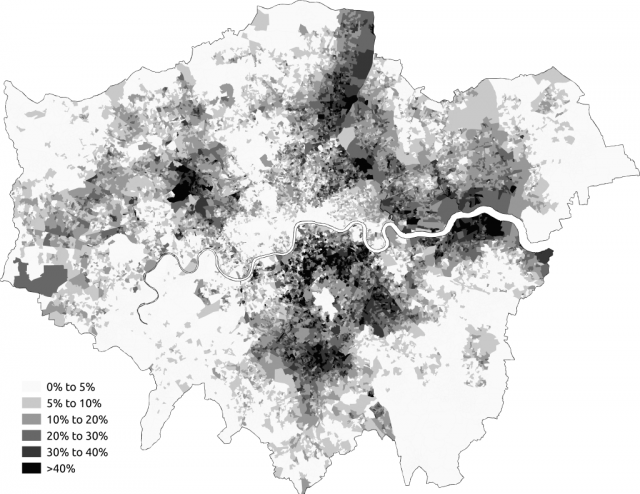
London is one of the most ethnically diverse cities in the world and the most in Europe. In 2007 there were over 300 languages spoken in it and more than 50 non-indigenous communities with a population of more than 10,000.
At the 2011 census London had a population of 8,173,941. Of this number, 44.9% were white British 37% of the population were born outside the UK, including 24.5% born outside of Europe.
| Ethnicity | No. of People | Percentage of Total |
| White: English/Welsh/Scottish/Northern Irish/British | 3669284 | 44.9 |
| White: Irish | 175974 | 2.2 |
| White: Gypsy or Irish Traveller | 8196 | 0.1 |
| White: Other White | 1033981 | 12.6 |
| White: Total | 4887435 | 59.8 |
| Mixed/multiple ethnic group: White and Black Caribbean | 119425 | 1.5 |
| Mixed/multiple ethnic group: White and Black African | 65479 | 0.8 |
| Mixed/multiple ethnic group: White and Asian | 101500 | 1.2 |
| Mixed/multiple ethnic group: Other Mixed | 118875 | 1.5 |
| Mixed/multiple ethnic group: Total | 405279 | 5 |
| Asian/Asian British: Indian | 542857 | 6.6 |
| Asian/Asian British: Pakistani | 223797 | 2.7 |
| Asian/Asian British: Bangladeshi | 222127 | 2.7 |
| Asian/Asian British: Chinese | 124250 | 1.5 |
| Asian/Asian British: Other Asian | 398515 | 4.9 |
| Asian/Asian British: Total | 1511546 | 18.4 |
| Black/African/Caribbean/Black British: African | 573931 | 7 |
| Black/African/Caribbean/Black British: Caribbean | 344597 | 4.2 |
| Black/African/Caribbean/Black British: Other Black | 170112 | 2.1 |
| Black/African/Caribbean/Black British: Total | 1088640 | 13.3 |
| Other ethnic group: Arab | 106020 | 1.3 |
| Other ethnic group: Any other ethnic group | 175021 | 2.1 |
| Other ethnic group: Total | 281041 | 3.4 |
| Total | 8173941 | 100 |


