| |
| Poverty
|
| Shop |
|
Home
|
|
|
Events
|
|
Campaign
to raise money for
The
ACE Fund
Finance
to Support, provide connections and fund black businesses
~
0 ~
Monthly
- EEGroup Meetings
Economic
Empowerment Group Meeting are held Monthly.
Where we Share, Debate, Plan & Take Action. Share
and Implement new strategies. Real Networking with like-minded
people.
Email
to Register
|
|
|
|
Poverty
Facts
There
is an ongoing debate about what ‘poverty’ means
and how to measure it. However, most commentators agree that
poverty needs to be understood in relation to typical living
standards in society. Here is a widely-used definition from
Professor Peter Townsend:
Individuals,
families and groups in the population can be said to be in
poverty when they lack the resources to obtain the types of
diet, participate in the activities, and have the living conditions
and amenities which are customary, or are at least widely
encouraged and approved, in the societies in which they belong.
Income poverty
A widely-used measure of poverty is where household income
is below 60 per cent of the median UK income after housing
costs have been paid. So-called income poverty rose in 2005/06
and 2006/07, but fell very slightly in 2007/08 (and rose after
housing costs were accounted for), after having previously
been on a downward trend for several years.
Every
year the Government publishes a survey of income poverty in
the UK, Households Below Average Income (HBAI). All the figures
on this page are from the most recent HBAI survey in 2009/10
unless otherwise stated. HBAI includes figures before and
after housing costs: we use the ‘after housing costs’
figures.
The HBAI
survey shows that 13.5 million people in the UK (22%) are
income poor. Of those 13.5 million people:
53% are
in families which include at least one child;
32% are in families of people of working age without children;
15% are in pensioner families.
People living below the poverty line are distributed around
the UK as follows:
England
- 11,615,000, or 23% of the English population;
Scotland - 969,000, or 19% of the Scottish population;
Wales - 667,000, or 23% of the Welsh population;
Northern Ireland - 374,000, or 2% of the Northern Irish population.
The poverty line
The poverty
line used here is 60 per cent of the median UK income after
housing costs have been paid. Below this amount, a household
is described as living in income poverty. The poverty line
is adjusted to take into account how expenditure needs differ
between types of households.
UK
POVERTY LINE FOR A RANGE OF HOUSEHOLDS, 2009/10
Household
type
Poverty line: Household income, £ a week
Single person, no children, £124
Couple with no children, £214
Lone parent with two children (aged 5 and 14), £256
Couple with two children (aged 5 and 14), £348
What
causes poverty?
The main
cause of poverty is inadequate income, arising from worklessness,
low wages and the low level of benefits.
Unemployment
In the three months to February 2011 statistics show unemployment
averaging 7.8 per cent of adults of working age. The recession
has led to a rapid increase in unemployment and this is expected
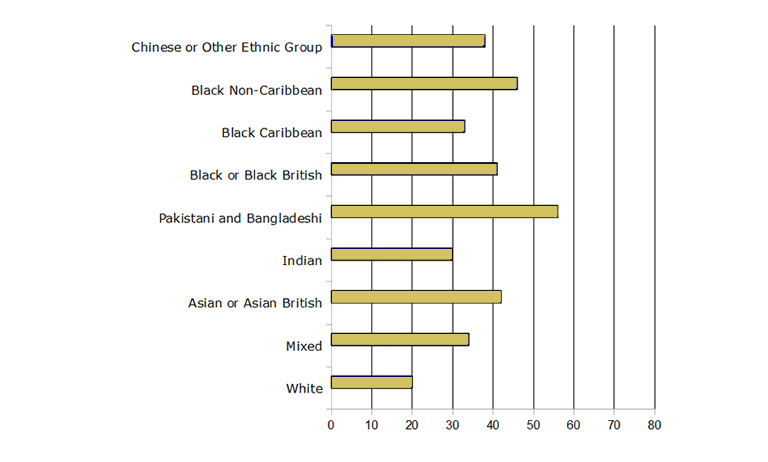
to rise further. [source] The risk of not being in work is
higher for those with low skills, from certain minority ethnic
groups, and for those living in low employment areas. Other
barriers to work include caring responsibilities and discrimination.
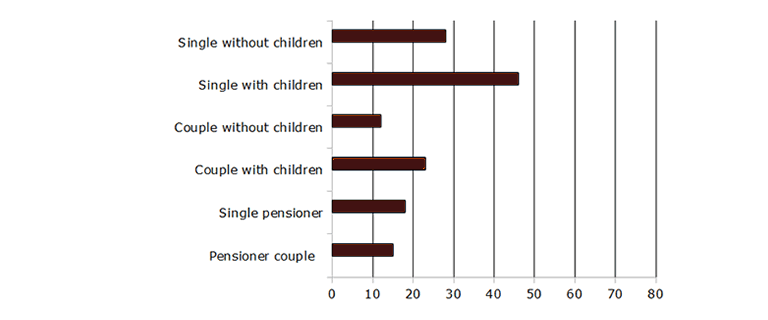
Low
wages
Paid work is not, on its own, a guarantee of being free of
poverty. In 2009/10, 58 per cent of income-poor children were
in households where one or more adult in the house was in
work. Low wages, part-time work and not having two adults
in work in a couple household all increase the risk of poverty.
Inadequate
benefits
Benefits and tax credits, that are supposed to act as a safety
net, are too low to protect families with children from poverty.
Their value remains significantly below the poverty line.
|
The impact of
poverty
Poverty makes
people’s lives shorter and more brutal than they need to be.
Poverty is not simply about being on a low income and going without
– it is also about being denied power, respect, good health,
education and housing, basic self-esteem and the ability to participate
in social activities.
Poverty has
costs to society as well as the individual. By limiting children’s
educational attainment it reduces the skills available to employers,
and impedes economic growth. For example a study by the Joseph Rowntree
Foundation found that child poverty costs Britain at least £25
billion a year. [source]
Impact on education
On average poorer children score less well on a range of educational
measures such as reading tests and GCSE results.
Pupils in England
who get 5 GCSEs at grades A* - C:
Pupils eligible
for free school meals – 30.9 per cent
Pupils not eligible for free school meals – 58.5 per cent
Pupils in England who score at or above level 4 at Key Stage 2:
Only 64.5% of
pupils in receipt of Free School Meals achieve an adequate level
in Key Stage 2 English, compared to 83.5% who are not on Free School
Meals.
71% of pupils in the poorest 10% of areas achieve an adequate level
in Key Stage 2 English, while 90.4% do in the richest 10% of areas
73.2% of pupils in the poorest 10% of areas achieve an adequate
level in Key Stage 2 Mathematics, while 89.1% do in the richest
10% of areas.
[source]
Impact on
health
Poverty is associated with a higher risk of both illness and premature
death.
Life expectancy
at birth varies significantly according to social class, with professional
men expecting to live to around 80 years and unskilled manual men
to 72.7 years, For women, the figures are 85.1 and 78.1 years. [source]
Poorer children
on average experience poorer health during their childhoods and
the effects of this last throughout their lives. Three-year-olds
in households with incomes below about £10,000 are 2.5 times
more likely to suffer chronic illness than children in households
with incomes above £52,000. [source]
The risk of
infant mortality is higher for poor children. In the lower social
group (routine and manual occupations) infant mortality is 5.9 infant
deaths per 1,000 live births. This is 20 per cent higher than the
average 4.9 per 1,000. [source]
Impact on
social participation
Poverty isolates people, reducing their ability to engage in social
and community life. In a study comparing the poorest and richest
fifth of households, poorer children had fewer opportunities for
activities and entertaining friends:
| Percentage
of children who wanted but could not afford it... |
Poorest
fifth |
Richest
fifth |
| a
hobby or leisure activity |
14% |
1% |
| to
have friends round for tea or a snack once a fortnight |
18% |
1% |
| to
go on a school trip at least once a term |
13% |
1% |
| to
have a one-week holiday away from home with family |
62% |
5% |
Source CPAG.
Child Proverty Action Group
|


FB
Page
Join
our Mailing List to the
Black Economics website
|
Special
Offers
|
| 1)
Free website for your business- Email
for details |
| |
| Email
us your offers to promote your business or event. |
|