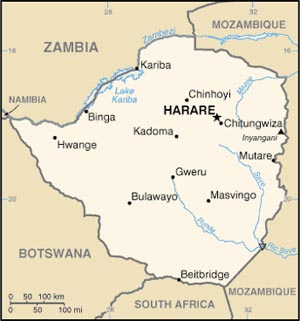
Geography
Area: 390,580 sq. km. (150,760 sq. mi.), slightly larger than Montana.
Cities: Capital–Harare (pronounced Ha-RAR-e), pop. 1.5 million.
Other towns–Bulawayo, Chitungwiza, Mutare, Gweru, Kwekwe, Masvingo, Marondera.
Terrain: Desert and savanna.
Climate: Mostly subtropical.
People
Nationality: Noun and adjective–Zimbabwean (sing.), Zimbabweans (pl.).
Population: 11.39 million.
Annual population growth rate (2005-2010 UN est.): 0.3%.
(Note: the population growth rate is depressed by an HIV/AIDS adult prevalence rate estimated to be 15.3% and a high level of emigration.)
Religions: Christianity 75%, offshoot Christian sects, animist, and Muslim.
Languages: English (official), Shona, Ndebele.
Education: Attendance–mandatory for primary level. Adult literacy–91%
Health: Infant mortality rate–62/1,000.
Life expectancy–44 years
Government
Type: Parliamentary.
Constitution: December 21, 1979.
Independence: April 18, 1980.
Main political parties: Zimbabwe African National Union-Patriotic Front (ZANU-PF); Movement for Democratic Change – Tsvangirai (MDC-T); Movement for Democratic Change – Mutambara (MDC-M); Zimbabwe African People’s Union (ZAPU).
Economy
GDP (2009 IMF est.): U.S. $4.4 billion.
Real GDP growth rate (2009 IMF est.): 4.01%.
GDP per capita (2009 IMF est., U.S. dollars, current prices): $375.
Avg. inflation rate (2009 IMF estimate): 8.9%.
Natural resources: Deposits of more than 40 minerals including diamonds, ferrochrome, gold, silver, platinum, copper, asbestos, nickel, graphite, coal, lithium, palladium, vermiculite; 19 million hectares of forest (2000).
Agriculture (19% of GDP): Types of crops and livestock–corn, cotton, tobacco, wheat, coffee, tea, sugarcane, peanuts, cattle, sheep, goats, pigs.
Industry (24% of GDP): Manufacturing, public administration, commerce, mining, transport and communication.
Trade (2009): U.S. exports–U.S. $85.5 million. U.S. imports–U.S. $22.1 million. Partners (2008 est.)–South Africa 32%, Democratic Republic of the Congo 10%, Botswana 9%, China 6%, Zambia 5%, U.S. 4%. Total imports (2009)–U.S. $2.03 billion: most of these imports were food, machinery, fertilizers, and general manufactured products. Major suppliers–South Africa 60%, China 4%, Botswana 4%.


